
A slow database is the bottleneck behind most performance complaints. A query that once returned in 50 milliseconds starts taking 2 seconds, usually because of small oversights: a missing index, a SELECT * that fetches 40 columns when you need 3, a connection opened and closed on every request.
This guide covers eight practices with measurable impact on real-world database performance. They apply across PostgreSQL, MySQL, SQL Server, and other relational databases. Every recommendation is grounded in official database documentation, not vendor benchmarks.
Why Database Optimization Matters
As an application grows, more rows, more concurrent users, and more complex queries all pressure the database. A 10,000-row table survives a missing index. A 10-million-row table with the same gap turns a scan into a multi-second operation that blocks other queries and cascades into slow page loads and timeouts.
The PostgreSQL documentation states the goal plainly: increase the rate at which queries return results. Optimization is a habit of measuring, adjusting, and re-measuring — not a one-time project.
Practice 1: Index Strategically, Not Indiscriminately
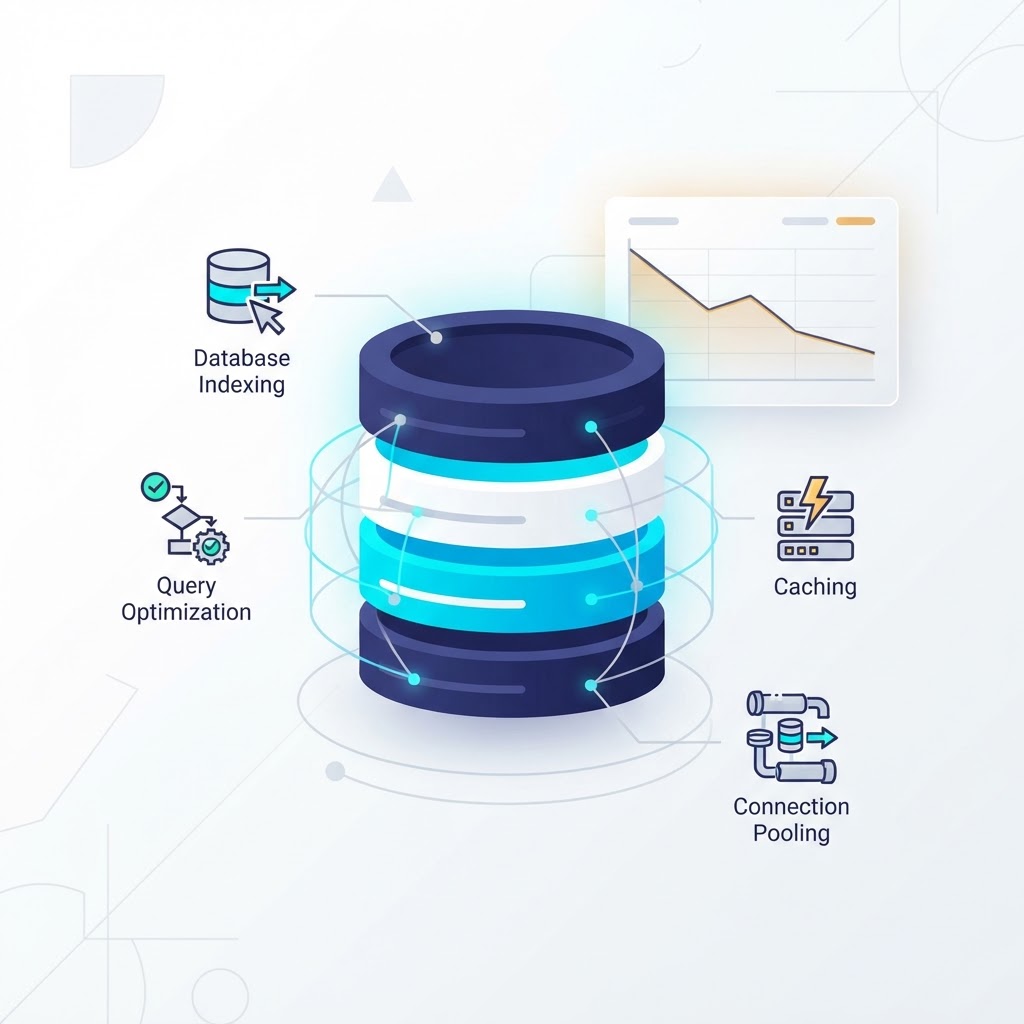
Indexes are the single most effective query performance tool. A B-tree index finds rows in O(log n) time instead of scanning every row. But indexes are not free — every INSERT, UPDATE, and DELETE must also update the index.
What to index
- Columns used frequently in
WHEREclauses - Columns used in
JOINconditions - Columns used in
ORDER BYorGROUP BY - Columns with high selectivity (many distinct values)
-- Good: index on a frequently filtered column
CREATE INDEX idx_orders_customer_id ON orders(customer_id);

-- Good: composite index when queries filter on two columns together
CREATE INDEX idx_orders_status_date ON orders(status, created_at);
What to avoid
- Indexing every column “just in case” — this slows down writes significantly
- Indexing low-selectivity columns (like a boolean
is_activewith only two values) - Creating redundant indexes (e.g., an index on
statuswhen you already have one onstatus, created_at— the composite index covers leftmost queries onstatusalone)
The PostgreSQL documentation recommends using EXPLAIN to verify that an index is actually being used before and after creating it. If the planner still chooses a sequential scan, the index is not helping and is just adding write overhead.
Practice 2: Write Selective Queries
The fastest query is the one the database does not have to run. The second fastest is the one that touches the fewest rows and columns. Query optimization is about asking the database for exactly what you need and nothing more.
Stop using SELECT *
SELECT * fetches every column in the table, including large text fields, JSON blobs, and columns the application never uses. When the table has 30 columns and the application needs 4, that is a significant waste of I/O and memory.
-- Bad: fetches all 30 columns
SELECT * FROM orders WHERE customer_id = 99;

-- Good: fetches only what you need
SELECT id, order_date, total, status
FROM orders
WHERE customer_id = 99;
Use LIMIT when you need a sample
If you only need to check whether matching rows exist, or you need the first few results, tell the database to stop scanning after finding enough rows.
-- Good: stops after 10 matches
SELECT id, email FROM users WHERE status = 'active' LIMIT 10;
Filter early, not late
Push filtering into the database rather than pulling rows into the application layer and filtering there. The database can use indexes to skip irrelevant rows; the application cannot.
Practice 3: Normalize First, Denormalize Deliberately
Normalization — organizing data into well-structured tables to eliminate redundancy — is the right starting point for most schemas. A schema in Third Normal Form (3NF) avoids data anomalies and keeps the data model clean. But strict normalization can sometimes require expensive joins on large tables.
The principle: start normalized, and denormalize only when profiling proves a specific query path is too slow.
When denormalization makes sense
- A report query joins 6+ large tables and runs every few minutes
- A column is computed from others frequently enough that materializing it saves measurable CPU
- A read-heavy table benefits from a precomputed summary column
How to denormalize safely
- Add a redundant column to one table, not a copy of the whole table
- Update it with a trigger or application logic, never by hand
- Document the reasoning in the schema so future developers understand the tradeoff
Denormalization responds to a measured problem, not a default design choice. Premature denormalization creates data integrity risks harder to fix than a slow join.
Practice 4: Monitor and Analyze Query Plans
You cannot optimize what you cannot see. Every relational database provides a query plan inspector that shows exactly how the database executes a query — which indexes it uses, whether it scans or seeks, and how many rows it estimates at each step.
PostgreSQL: EXPLAIN ANALYZE
EXPLAIN ANALYZE
SELECT id, order_date, total FROM orders
WHERE customer_id = 99 AND status = 'shipped';
EXPLAIN ANALYZE actually runs the query and reports real timing, not just estimates. Look for:
- Seq Scan on a large table — this often means a missing index
- Index Scan or Index Only Scan — the index is being used
- Nested Loop on large row counts — consider a different join strategy or index
- Sort with
disk sort— the sort is spilling to disk becausework_memis too low
What to do with the plan
A sequential scan on a large table often means a missing index. If the estimated row count is far from actual, run ANALYZE (PostgreSQL) or ANALYZE TABLE (MySQL) to update statistics.
Practice 5: Partition Large Tables
When a single table grows to tens of millions of rows, even indexed queries can slow down because the index itself becomes large. Partitioning splits a large table into smaller physical pieces based on a rule — by date range, by list of values, or by hash — while keeping it logically unified.
Range partitioning by date
The most common pattern: partition a time-series table (orders, logs, events) by month or quarter.
When a query filters on order_date, PostgreSQL scans only the relevant partition instead of the entire table. Dropping old data becomes a fast metadata operation (DROP TABLE orders_2025_01) instead of a slow DELETE.
When to partition
Tables over 10 million rows where queries filter on the partition key — especially log, event, or order tables that grow continuously and need old data archived. PostgreSQL supports declarative partitioning since version 10; MySQL supports it with InnoDB since version 5.7.
Practice 6: Use Connection Pooling
Opening a new database connection is expensive. It involves a TCP handshake, authentication, and session setup. If your application opens a new connection for every query and closes it immediately, a significant chunk of response time is spent on connection overhead — not on the query itself.
How pooling works
A connection pooler maintains a set of open connections and lends them to requests. When a request finishes, the connection goes back to the pool instead of being closed. The next request reuses it instantly.
Popular poolers
| Database | Pooler | Notes |
|---|---|---|
| PostgreSQL | PgBouncer | Lightweight, runs between app and database |
| PostgreSQL | Pgpool-II | Pooling plus load balancing and replication |
| Java apps | HikariCP | Application-level pool, fastest JVM pool |
| Python (Django, SQLAlchemy) | Built-in pool | Configure CONN_MAX_AGE (Django) or pool_size (SQLAlchemy) |
Configuration guidance
- Set the pool size to match your expected concurrent queries, not your total user count
- Most applications need 10-50 connections, not hundreds — more connections create contention, not parallelism
- Use
PgBouncerin transaction mode for serverless or auto-scaling environments where connections spike and drop
Practice 7: Cache Aggressively
The fastest query is the one you never send. Caching stores expensive query results in memory so subsequent requests skip the database entirely.
What to cache
- Results of queries that change infrequently (reference data, lookup tables, configuration)
- Aggregated counts or summaries that are recomputed on every page load
- API responses assembled from multiple database queries
Cache layers
| Layer | Tool | Best for |
|---|---|---|
| In-memory key-value | Redis | Session data, computed results, query result cache |
| In-memory key-value | Memcached | Simple, lightweight caching with no persistence needs |
| Application-level | Language-specific | In-process cache for small, rarely-changing data |
| Database-level | Materialized views | Precomputed query results stored in the database |
Cache invalidation
The hard part is knowing when the cache is stale:
- Time-based (TTL): expire the cache after a set interval — simplest, good for data that can tolerate being slightly stale
- Write-through: update the cache whenever the underlying data changes — more accurate but more complex
- Event-based: invalidate the cache when a specific event occurs (a new order, a status change)
Always set a TTL as a safety net, even if you also use write-through invalidation. A cache entry with no TTL is a cache entry that will eventually serve stale data.
Practice 8: Tune Database Configuration
Databases ship with conservative default settings designed to work on minimal hardware. A production server with 16 GB of RAM running with shared_buffers at its default of 128 MB is leaving significant performance on the table.
Key parameters (PostgreSQL)
| Parameter | Default | Recommended | Why |
|---|---|---|---|
shared_buffers |
128 MB | 25% of system RAM | Primary cache for data pages |
work_mem |
4 MB | 16-64 MB | Sort/hash memory per query |
effective_cache_size |
4 GB | 50-75% of RAM | Planner cache-hit estimate |
maintenance_work_mem |
64 MB | 256 MB+ | VACUUM and reindex speed |
Key parameters (MySQL)
| Parameter | Default | Recommended | Why |
|---|---|---|---|
innodb_buffer_pool_size |
128 MB | 50-70% of RAM | InnoDB data and index cache |
innodb_log_file_size |
48 MB | 256 MB+ | Fewer checkpoint flushes |
max_connections |
151 | Match pool size | Too high wastes memory |
query_cache_size |
1 MB | 0 (MySQL 8.0+) | Removed in 8.0 — use app caching |
PostgreSQL’s documentation recommends shared_buffers at about 25% of system RAM. The planner uses effective_cache_size to estimate cache hit probability — setting it too low causes the planner to prefer sequential scans over faster index scans.
Important: Always benchmark before and after configuration changes. Default recommendations are starting points, not universal truths. Every workload is different.
Common Mistakes to Avoid
- Blindly adding indexes without checking the query plan — a useless index costs write performance for zero benefit
- Using SELECT * everywhere — fetches unnecessary columns and prevents index-only scans
- Ignoring slow query logs — PostgreSQL and MySQL both flag slow queries automatically
- Over-allocating connections — more connections create contention, not parallelism
- Caching everything — cache only what is expensive to compute and stable enough to reuse
- Tuning parameters blindly — if 100 queries each use 1 GB of
work_mem, the database needs 100 GB of RAM
Putting It Together
Start with the highest-impact steps: enable slow query logging, run EXPLAIN ANALYZE on the slowest queries, add the indexes the plan reveals, replace SELECT * with explicit columns, add a connection pooler, and cache repeated results. As data grows, evaluate partitioning, tune configuration based on real metrics, and denormalize only when profiling shows a problem.
Conclusion
A well-optimized database is the product of consistent, measured adjustments — the right index, the right query, the right cache, applied where profiling shows they are needed. Measure before you change, verify after, and document what you did so the next developer does not start from scratch.
If your team is building software that depends on a fast, scalable database — whether for a customer-facing application or an internal tool — Ideativemind builds custom software with performance built in from day one. Contact us to talk about your project.


 By
By